Slow webapp page loads
Monitor - https://legion-security.sentry.io/issues/alerts/rules/details/401858/
Dashboard - https://legion-security.sentry.io/dashboard/313221/?environment=vercel-production
Overview
What is a slow page load in sentry? What is the meaning of this alert? In 1 sentence how should we deal with such alerts
Collecting information:
- On the Sentry alert page, look for the recent page load spike that crosses the red line in the graph.
- Select around the spike with the mouse, and zoom in, then click "Open in Explore".
- In the traces pages, look at the pageload spans table, and sort by span.duration column.
- Identify the slowest pageloads (should be above 20s as the alert was fired) and click on the span ID in the table.
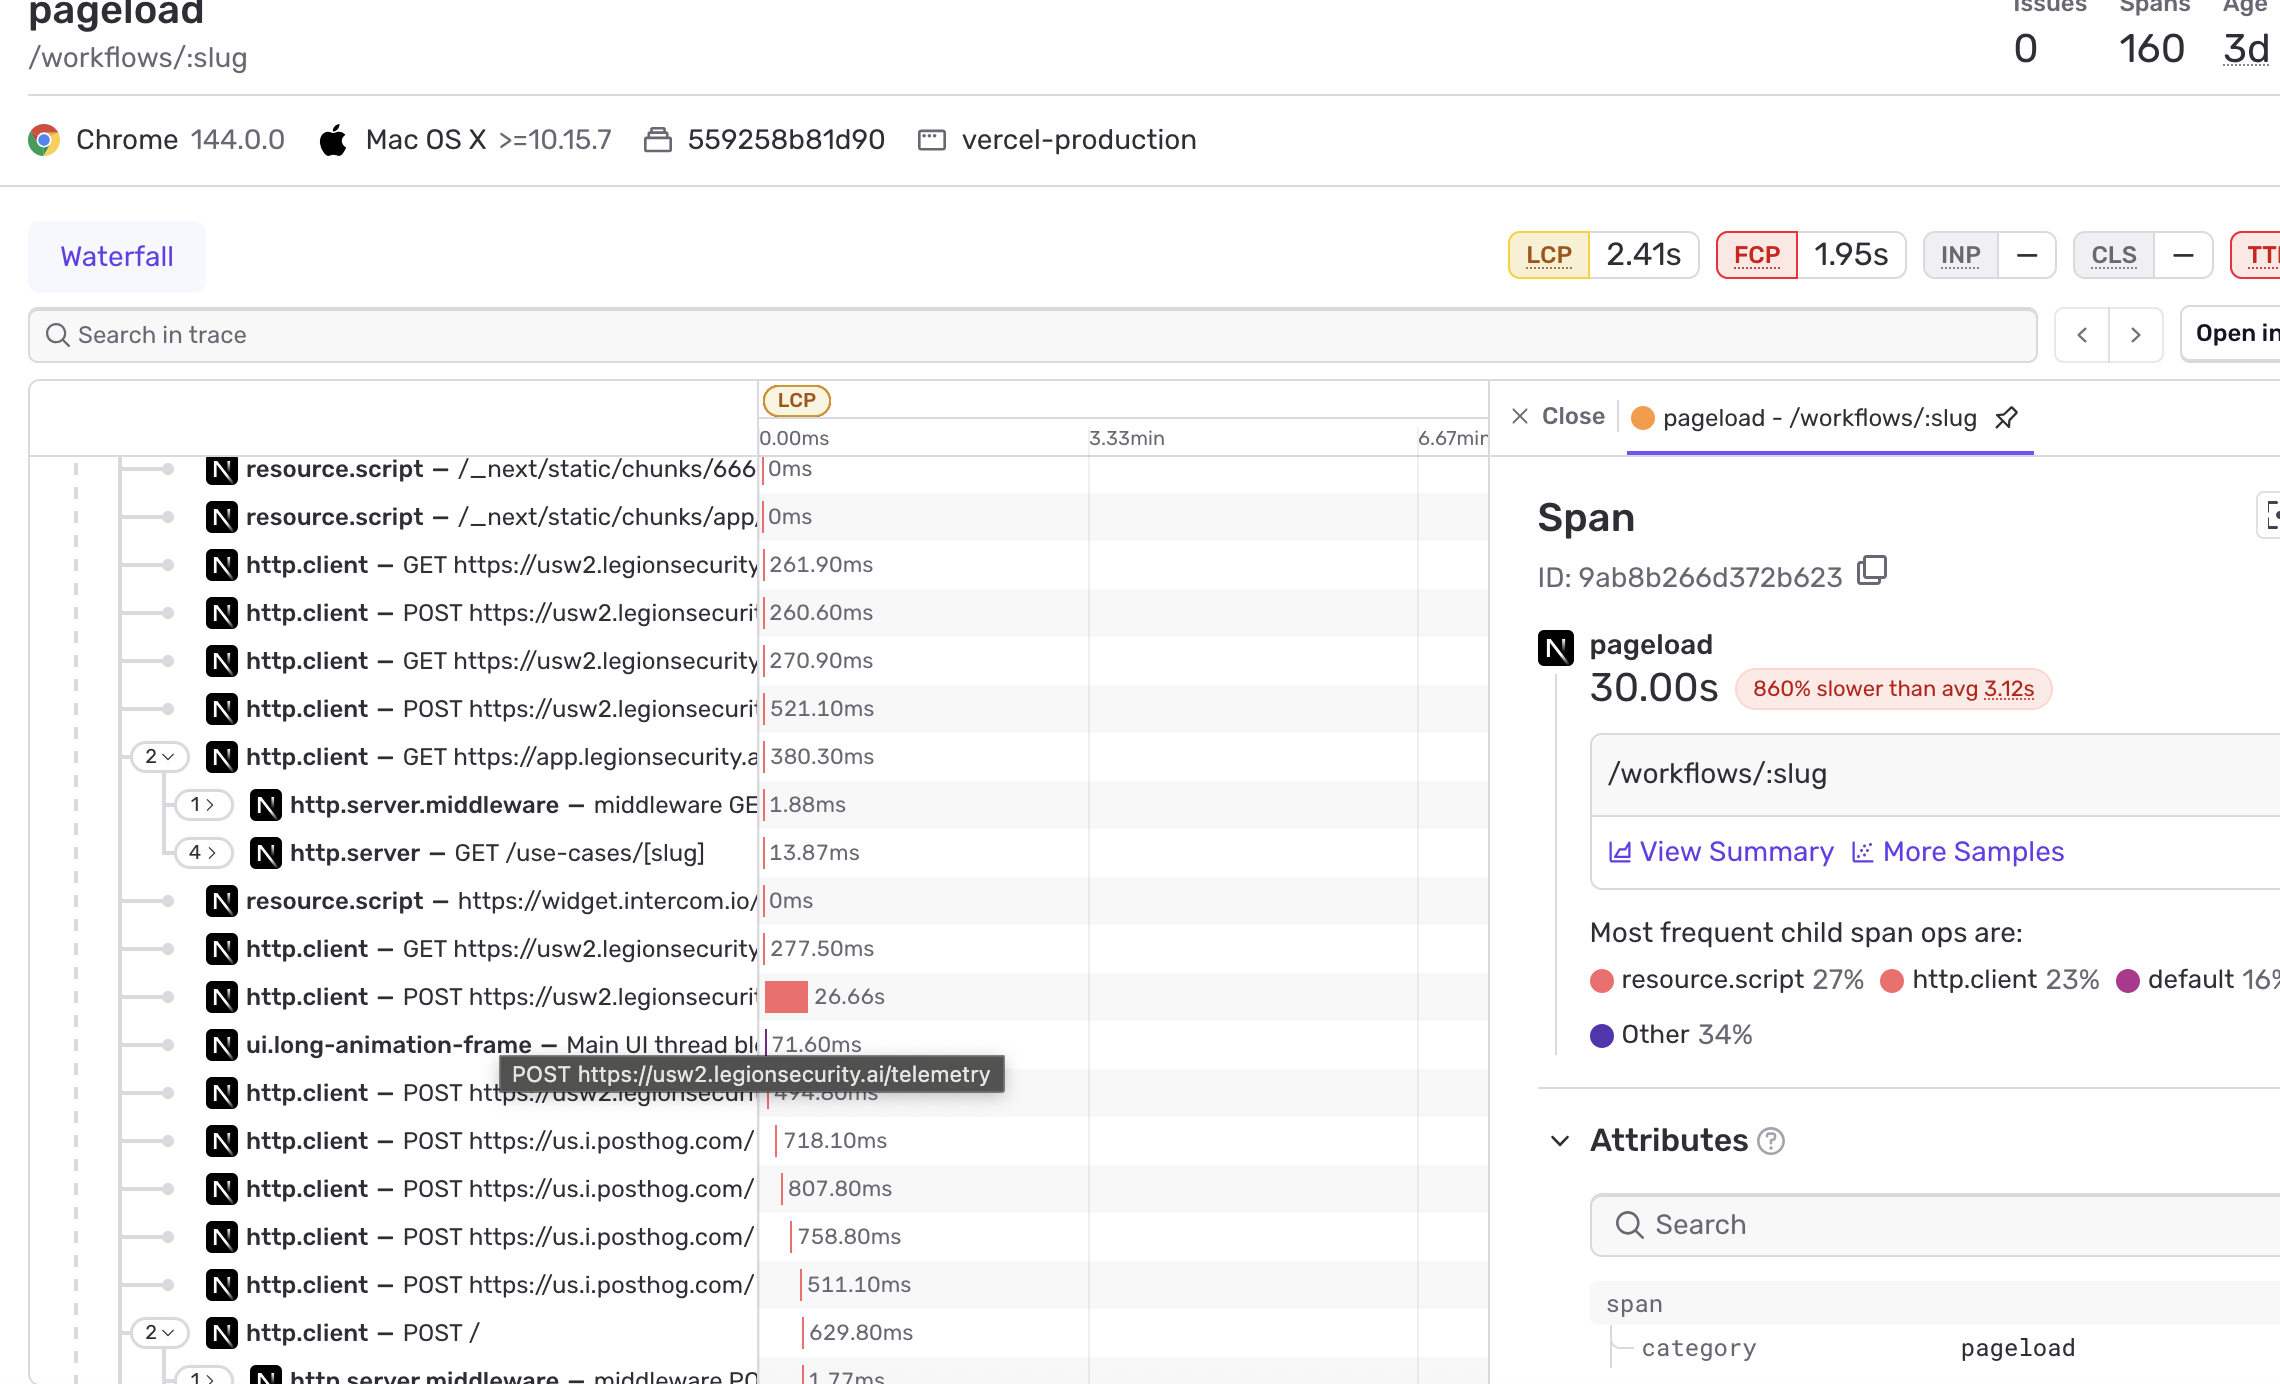
- On the trace page you will see the timeline of spans. Identify the spans which caused the pageload to be slow. These could be, for example:
- Slow HTTP requests
- Some network issue (DNS connection) on the client side.
- Some rendering issue. You might need to expand some of the spans in the Waterfall to reveal the inner spans.
Finding the problem
A slow page load can have several root causes, each requiring a different response:
Benign causes (no action needed)
- Third-party provider slowness (e.g. Intercom) — these slow the page load metric but do not prevent the user from interacting with the page.
- Slow telemetry requests — similarly, these inflate the page load duration without affecting the user experience.
- Sporadic network-related slowness — there is a known issue where occasional network slowness appears in traces. This is usually not reproducible and is not related to a backend problem.
In all of the above cases, no action is needed and the alert can be ignored.
Causes that require investigation
- Slow HTTP requests to the Legion backend — this may indicate a regression in the webapp or a slow backend call (e.g. a slow DB query or heavy processing).
- Webapp rendering issues — rendering loops or unhandled errors can cause the page to hang or load slowly.
Steps to investigate:
- Try loading the same page yourself and check if the slowness is consistently reproducible.
- Check the Sentry Issues page for recent errors or rendering-related exceptions that may point to a loop or crash.
- If the issue is a slow backend call, investigate further using the Axiom dashboard to identify the slow query or processing step.